Practical usage of Sysdig OSS
To address Sysdig’s 5/5/5 Benchmark, rapid troubleshooting and deep forensic investigation are crucial when a security breach or performance issue arises. While Falco excels at real-time threat detection based on system call activity, Sysdig serves as the go-to tool for post-incident analysis. Comparable to Wireshark in the packet capture paradigm, Sysdig Inspect provides a similarly powerful interface for analyzing system calls, offering a deep-dive into the behavior of containers, applications, and systems run in Linux hosts.
What is Sysdig OSS?
Sysdig Inspect is an open-source tool designed for container troubleshooting and security investigations. Think of it as the forensic companion to Falco — where Falco detects threats in real-time, Sysdig Inspect helps you understand what happened after an incident has occurred. It provides a detailed look into system calls, enabling Digital Forensics & Incident Response (DFIR) practitioners to trace the activity leading up to a breach, understand container behavior, and correlate findings for better threat detection rule design in Falco.
Captures: Sysdig’s equivalent of packet captures
Wireshark captures network traffic to a .pcap file, allowing for point-in-time network forensics. Similarly, Sysdig Inspect records system call activity to a .scap file, capturing every syscall across your infrastructure. Whether you are troubleshooting performance bottlenecks or investigating suspicious activity in your cloud-native applications, Sysdig Inspect offers unparalleled insights.
Where Wireshark has tshark for terminal-based packet captures, Sysdig Inspect offers even more flexibility for cloud incident responders. You can run captures in headless environments directly from the command line, providing a lightweight option to gather data even in resource-constrained or remote setups.
The Sysdig Inspect UI is a forensic investigator’s dream
Sysdig Inspect also features a powerful user interface (UI) that simplifies navigation through the vast amount of system, network, and application activity captured in .scap files. With a user-friendly design, it lets you filter, explore trends, and correlate key metrics, helping you find the “needle in the haystack” during your investigations. Its granular introspection into container activity offers deep visibility into system behaviors, whether you are investigating security incidents or performance problems.
With Sysdig Inspect, security engineers and performance analysts alike can delve into details such as:
- System Activity: Every system call made, from file accesses to network connections.
- Network Interactions: Observing how containerised processes communicate across the network.
- Container Insights: Detailed introspection into container behaviors and vulnerabilities.
These insights help cloud security engineers and developers alike to not only resolve issues but also improve Falco detection logic based on real-world findings.
Using Sysdig with the CLI
Sysdig Inspect’s versatility shines in its command-line interface (CLI), making it an essential tool for cloud environments where UIs may not always be accessible. The CLI captures everything happening at the system call level, even across highly dynamic, multi-container environments.
To get started, you can install Sysdig Inspect in just a single step:
curl -s https://s3.amazonaws.com/download.draios.com/stable/install-sysdig | sudo bashCode language: Perl (perl)This installer performs all necessary pre-flight checks, ensuring the correct version of Sysdig is installed based on your Linux distribution and kernel version. The single-command setup makes deployment fast and simple, getting you ready for your first capture within minutes.
Now that Sysdig is installed, you can run the Sysdig command with no filters. Similar to running Wireshark without any specified filters, it’s completely impossible to read. This is because it’s a real-time stream of all System call activity.
Instead, let’s run a 5 Second capture with the below timeout commands:
timeout 5 sysdig -w nigel-capture.scapCode language: Perl (perl)You can read the content of the nigel-capture.scap file with the below command:
sysdig -r nigel-capture.scapCode language: Perl (perl)We see the epoll_pwait event type being generated when a program waits for an I/O event on an epoll file descriptor. Maybe I only want to see those specific system call events. Let’s modify the command accordingly:
sysdig -r nigel-capture.scap evt.type=epoll_pwaitCode language: Perl (perl)I’m super interested in the kube-apiserver process since it validates and configures data for all of the API objects such as pods, services, and replication controllers in Kubernetes. Since Sysdig Inspect supports boolean logic, let’s include the and operator for including an additional process name to our query:
sysdig -r nigel-capture.scap evt.type=epoll_pwait and proc.name=kube-apiserverCode language: Perl (perl)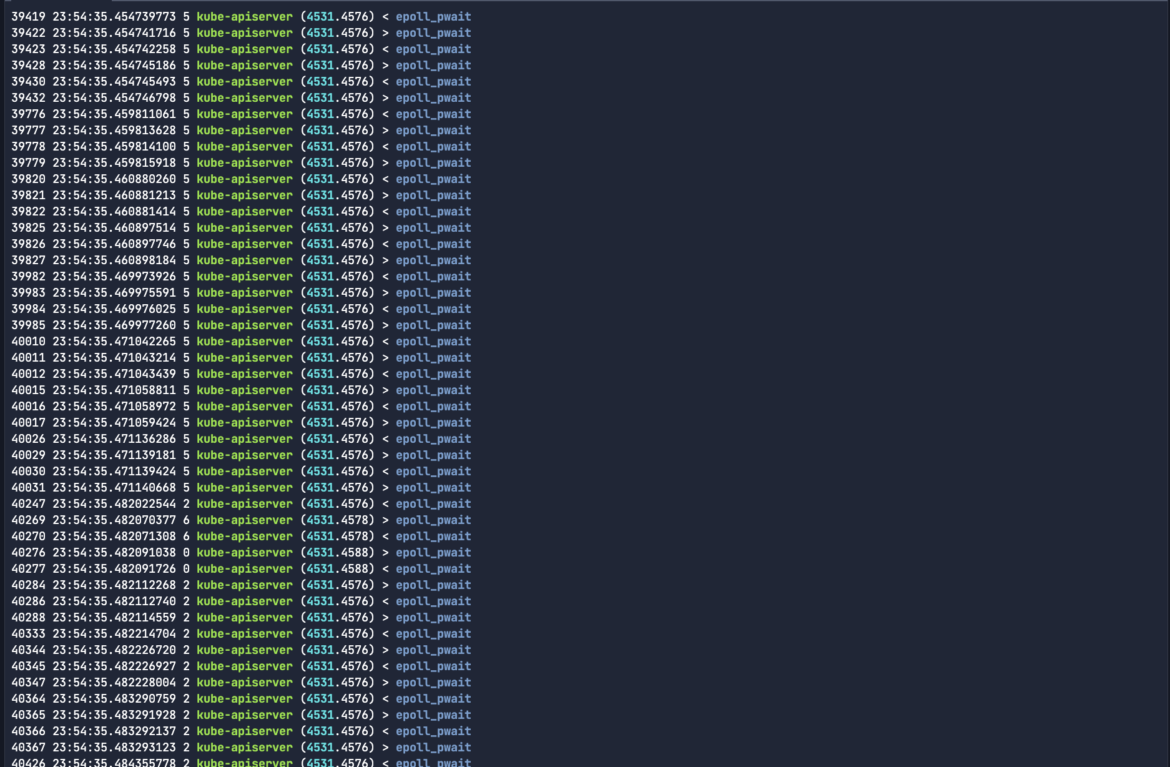
I’m happy with the output, but it didn’t really solve any problem. Let’s learn more about Sysdig Inspect command line arguments so that we can better understand our system.
Monitoring a microservice architecture
Let’s introduce a generic microservice architecture, with a frontend workload, a backend database type application and some other intermediary microservices that communicate. Let’s apply the storefront-demo deployment manifest to our Kubernetes cluster:
kubectl apply -f https://installer.calicocloud.io/storefront-demo.yamlCode language: Perl (perl)Check the IP addresses that were dynamically assigned to our workloads once they are up-and-running:
kubectl get pod -n storefront -o wideCode language: JavaScript (javascript)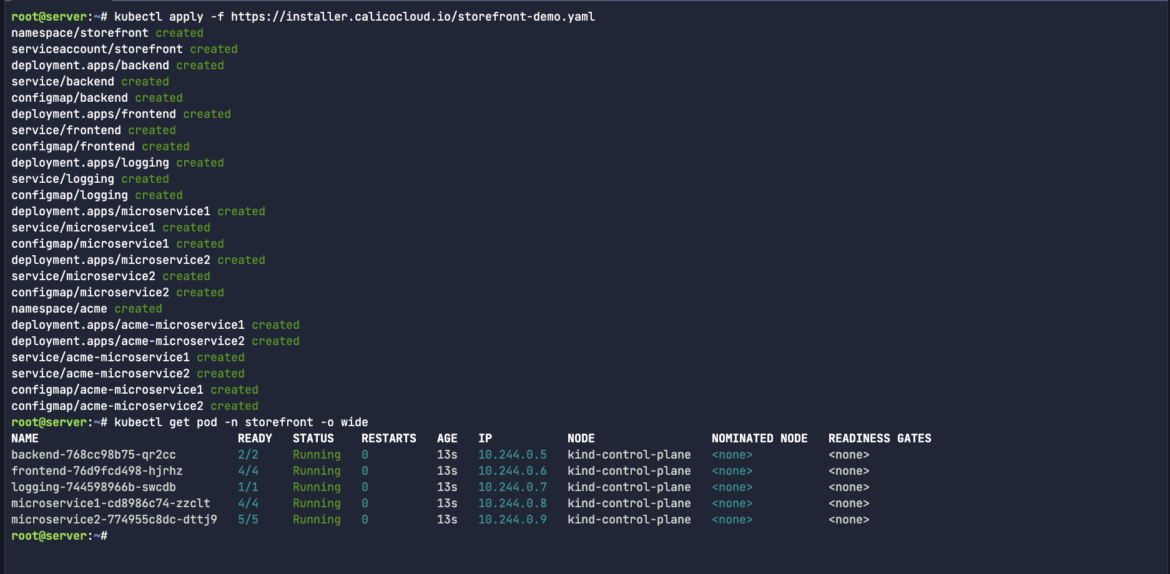
Of course Kubernetes pods are an abstraction of Kubernetes. If we wanted to better understand the actually processes that are running on those workloads you can run commands like ps aux and top:
In my case, I will also grep/filter the search down for peira related process activity.
ps aux | grep -a "peira"Code language: Perl (perl)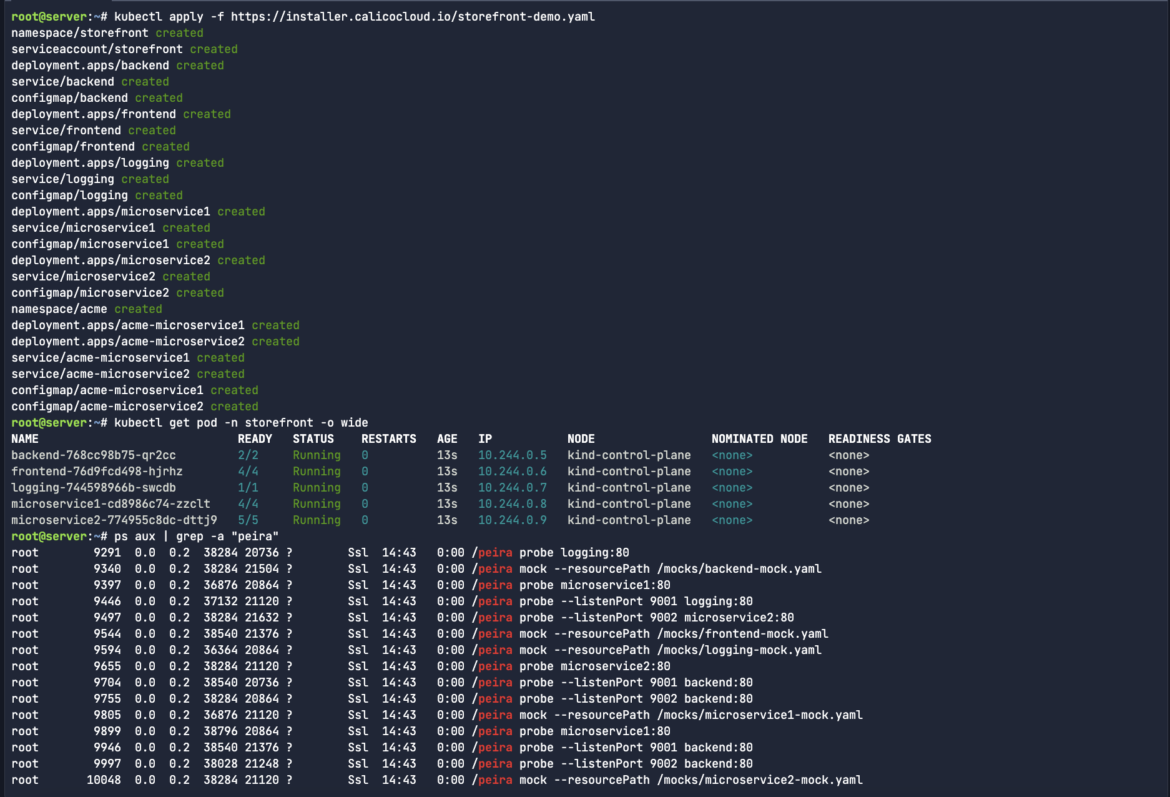
The process peira you’re seeing in your Kubernetes cluster appears to be related to some form of service probing or mocking tool. Based on the command lines in the ps aux output, peira seems to perform two main functions:
- The probe instances are responsible for checking or monitoring services in your cluster. They interact with various services (such as logging, microservice1, backend, etc.) on specific ports (:80, :9001, :9002). Probes are often used to check service availability, latency, or to perform health checks.
- The mock instances are loading mock configurations from YAML files (e.g., /mocks/backend-mock.yaml). This suggests that peira is also simulating or mocking services for testing purposes, allowing other parts of the system to interact with a “fake” service that mimics real behavior without involving the actual backend.
Let’s run a brand new capture for 5 Seconds to capture the peira process activity:
timeout 5 sysdig -w storefront-capture.scapCode language: Perl (perl)For the purpose of filtering Sysdig for multiple process sources, let’s check for the sandbox-agent as well as peira to see if both processes are present in our .scap file:
sysdig -r storefront-capture.scap proc.name=sandbox-agent or proc.name=peira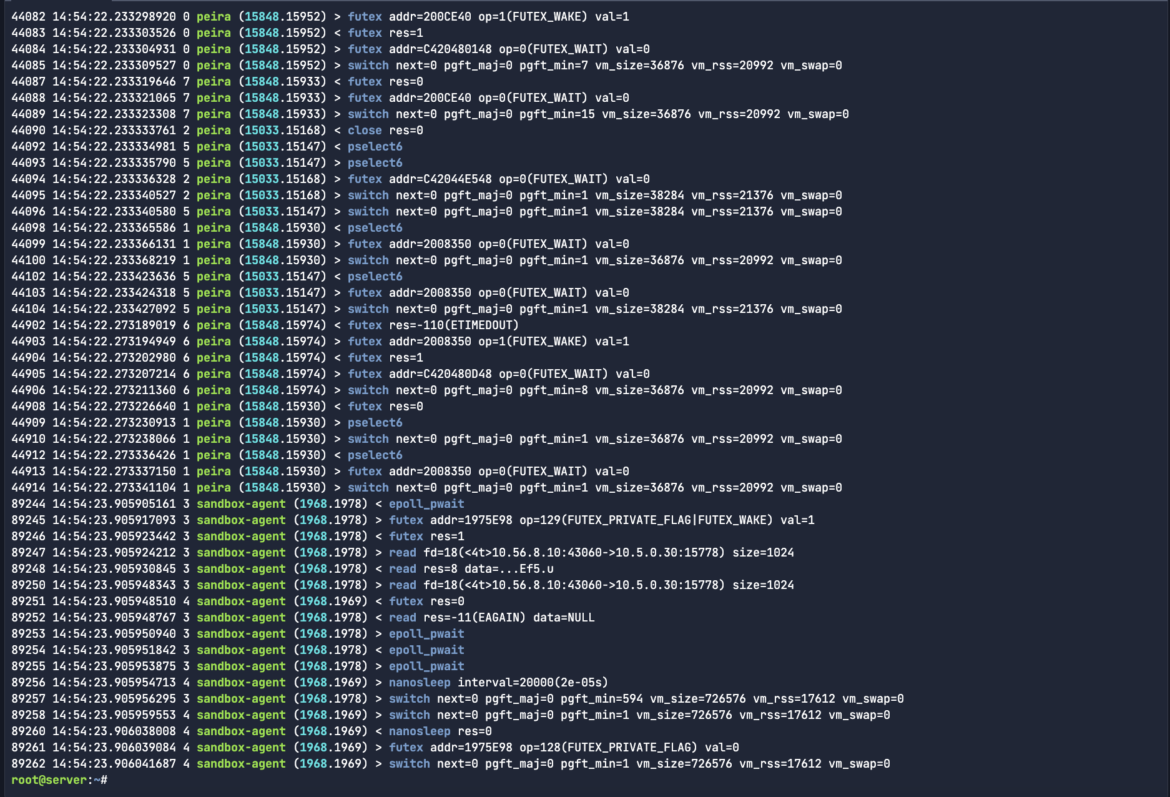
Now that we took care of the basics, let’s start having some fun. Sysdig’s filtering system is powerful and versatile, and is designed to look for needles in a haystack. Filters are specified at the end of the command line, like in tcpdump, and can be applied to both a live capture or a capture file.
Introducing a rogue or malicious workload
Thanks to the team at Project Calico, we install their public-facing rogue workload example into the same storefront network namespace.
kubectl apply -f https://installer.calicocloud.io/rogue-demo.yaml -n storefrontCode language: Perl (perl)Let’s find out what IP address is assigned to our newly-created rogue workload. We want to use that source IP address as a filter in our Sysdig Inspect capture:
kubectl get pods -n storefront -o wide | grep attacker-appCode language: JavaScript (javascript)
As always, let’s capture all traffic, including the unwanted/rogue traffic in order to identify that needle in the haystack:
timeout 5 sysdig -w malicious-traffic.scapCode language: Perl (perl)nmap is a powerful tool for ethical hackers who want to scan and analyze network traffic and logs. It can help you discover hosts, ports, services, vulnerabilities, and other information about your target network. By simply filtering for the process nmap and the Source IP of the workload, we see all of the attacker traffic from that newly-created pod.
sysdig -r malicious-traffic.scap "proc.name=nmap and evt.type=sendto and fd.sip=10.244.0.8"Code language: Perl (perl)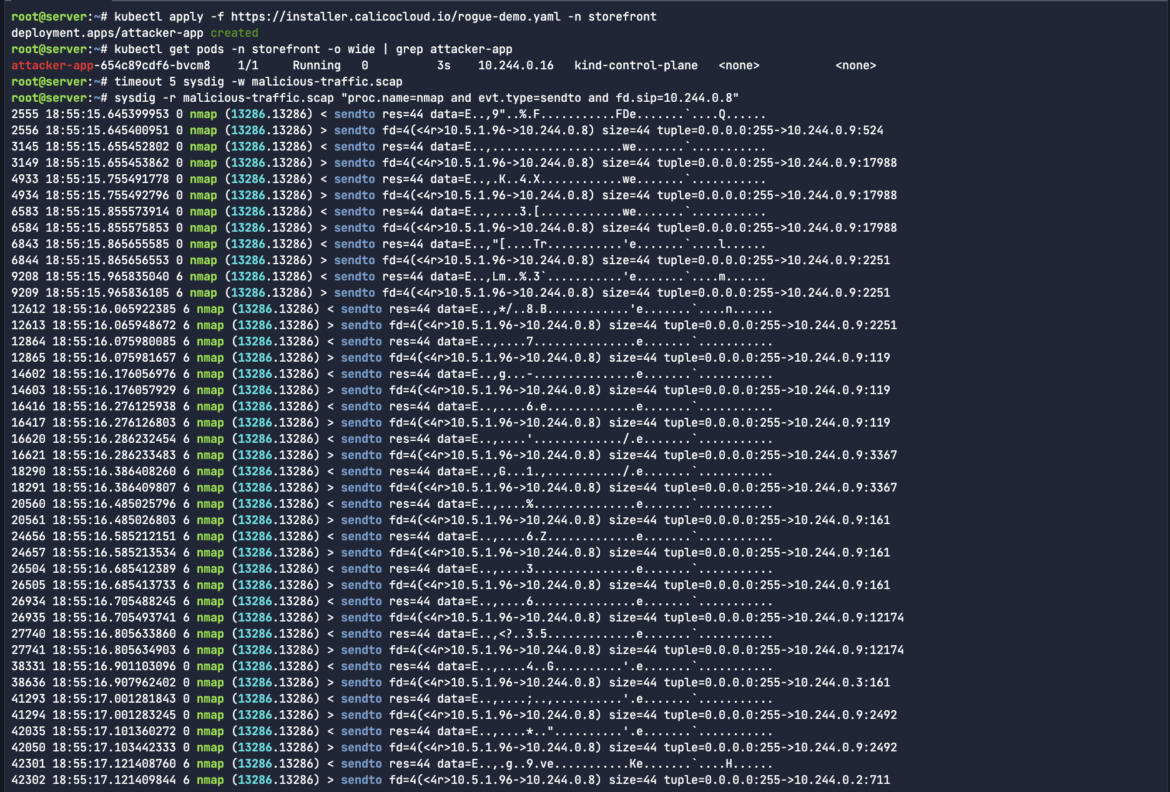
Use -S or –summary to print the event summary (i.e. the list of the top events) when the capture ends.
This allows users to better understand exactly what system calls were generated, and how many events were triggered within that capture file. This sort of executive summary can help teams to prioritize system calls that will be scoped into their Falco detection rules, or as part of the incident response troubleshooting.
sysdig -r malicious-traffic.scap proc.name=nmap --summaryCode language: Perl (perl)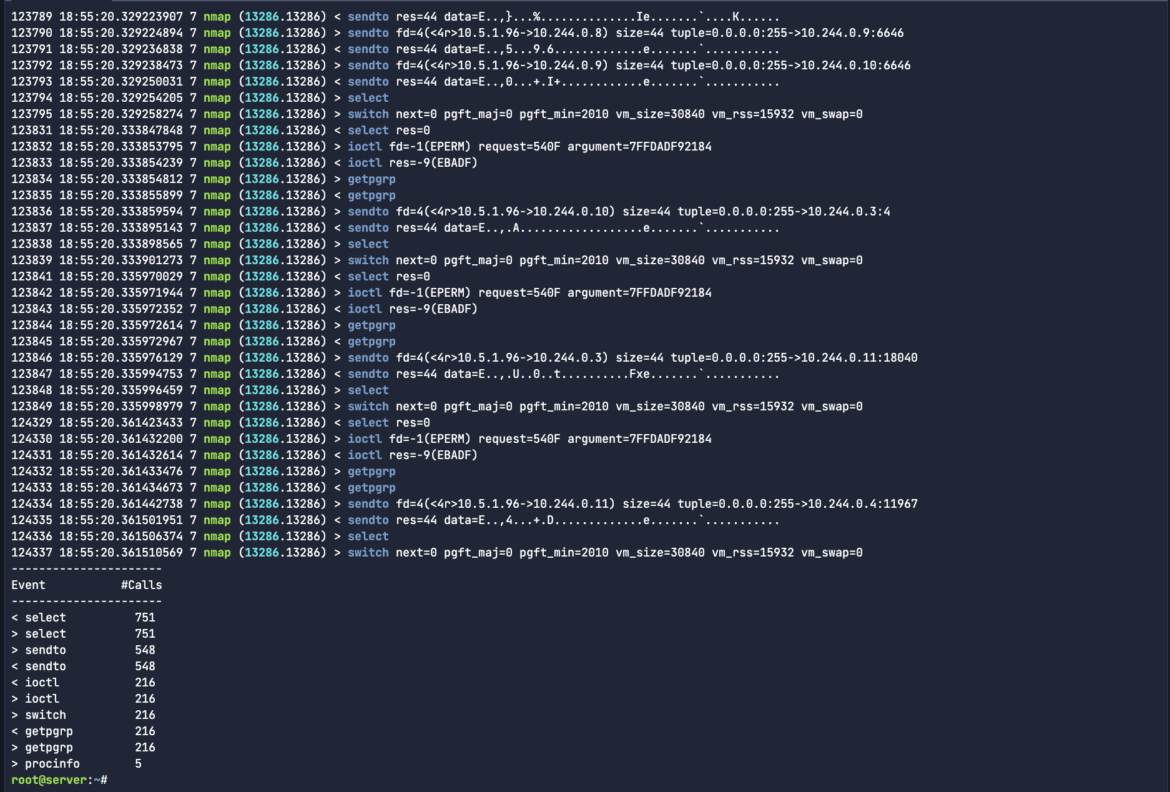
Let’s say I wanted to see that .scap output for the malicious network traffic in ASCII format. I can do that just like in Wireshark and tshark. Run the below command with the --print-hex-ascii flag:
sysdig -r malicious-traffic.scap "proc.name=nmap and evt.type=sendto and fd.sip=10.244.0.8" --print-hex-asciiCode language: Perl (perl)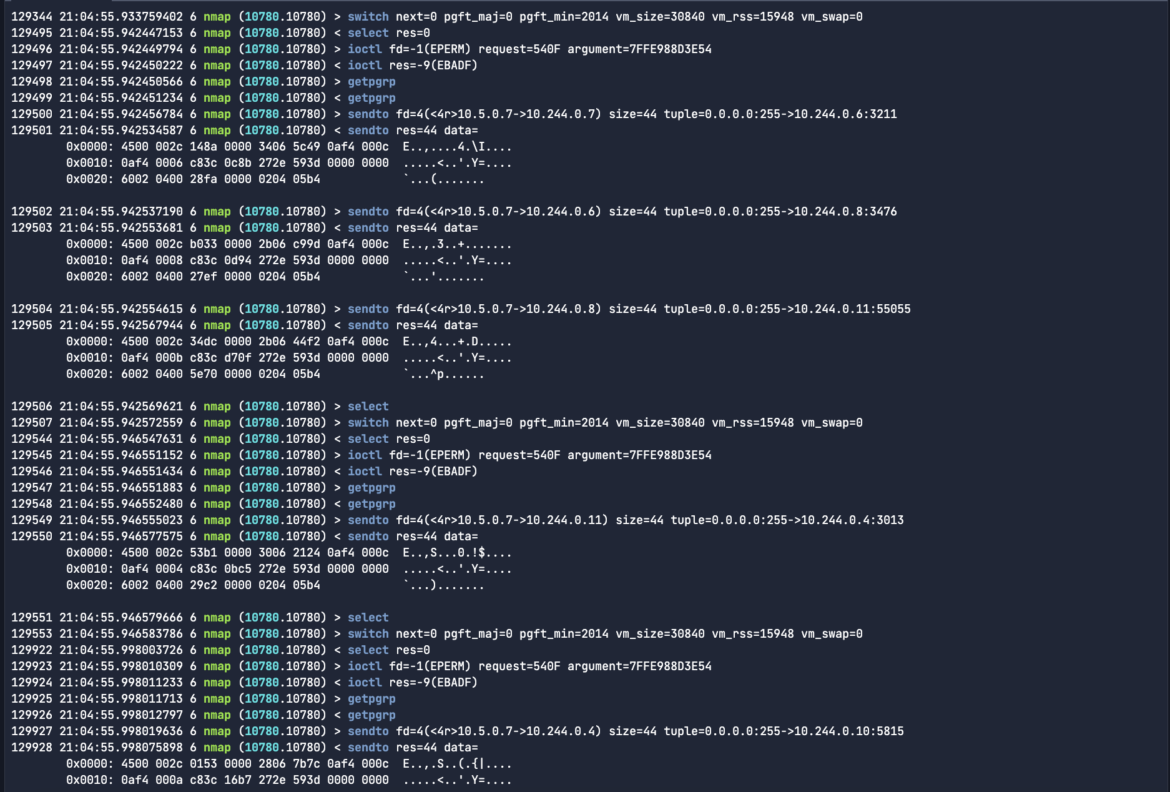
ASCII format is useful in Sysdig captures because it allows easy readability and analysis of system call data, making it simpler to identify issues during security investigations or troubleshooting. If I’m trying to find some plain-text write activity, or communications to a specific C2 server endpoint address, I would just grep for the specific activity like xmrig or a mining pool address. In the below example, we see connections established to twilio:
sysdig -r malicious-traffic.scap "proc.name=wget and evt.type=write" | grep -a "api.twilio.com"Code language: Perl (perl)
File Integrity Monitoring (FIM)
I want to monitor instances where files are opened and/or deleted. In order to automate this process, I created a simple background script that will run on 5 second intervals. You can download the below file_watcher.sh script, convert it to a .sh executable and then run the file as a background process:
wget https://raw.githubusercontent.com/nigel-falco/sysdig-inspect/main/file_watcher.sh
chmod +x file_watcher.sh
./file_watcher.sh &Code language: Perl (perl)
Unlike the scenarios earlier where we wrote a capture to a .scap file, you’ll notice that the next command is tracing the output in the terminal of all cat activity (basic read operations on a file) where the event buffer contains literal string context. In this case, it’s the helloworld data that I keep writing to the same file:
sysdig proc.name=cat and evt.type=read and evt.buffer contains helloworldCode language: Perl (perl)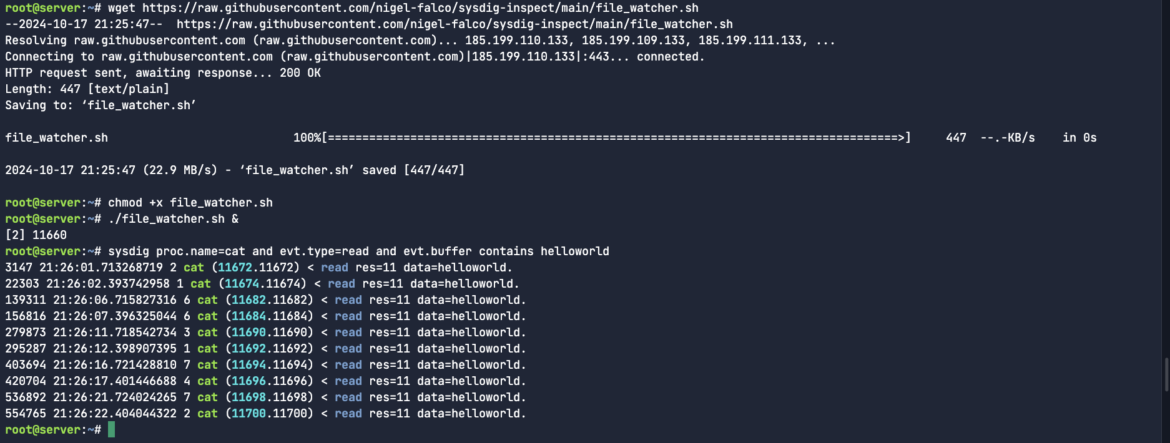
If there’s an issue with FIM, you will also want to know the directory from which the changes are being made. In our case, we can see it’s being written to the root directory:
sysdig -p"%evt.arg.name" proc.name=cat or evt.type=open | grep helloworldCode language: Perl (perl)
The sysdig -p command allows you to specify a custom output format for the captured events in Sysdig. You can use it to define the fields you want to display and how they are formatted. The -p flag is followed by a format string that specifies the fields to include, such as process name, user, file descriptors, system call types, etc. This is useful for tailoring the output to show only relevant information for specific use cases, like performance investigations.
Chisels
Sysdig chisels are little scripts that analyze the Sysdig event stream to perform useful actions. To get the list of available chisels, type:
sysdig -clCode language: Perl (perl)There are a bunch of interesting categories for chisels. From error handling to resource usage, logs, system state to security and tracers. We couldn’t possibly cover all of these chisels in a single blog post.
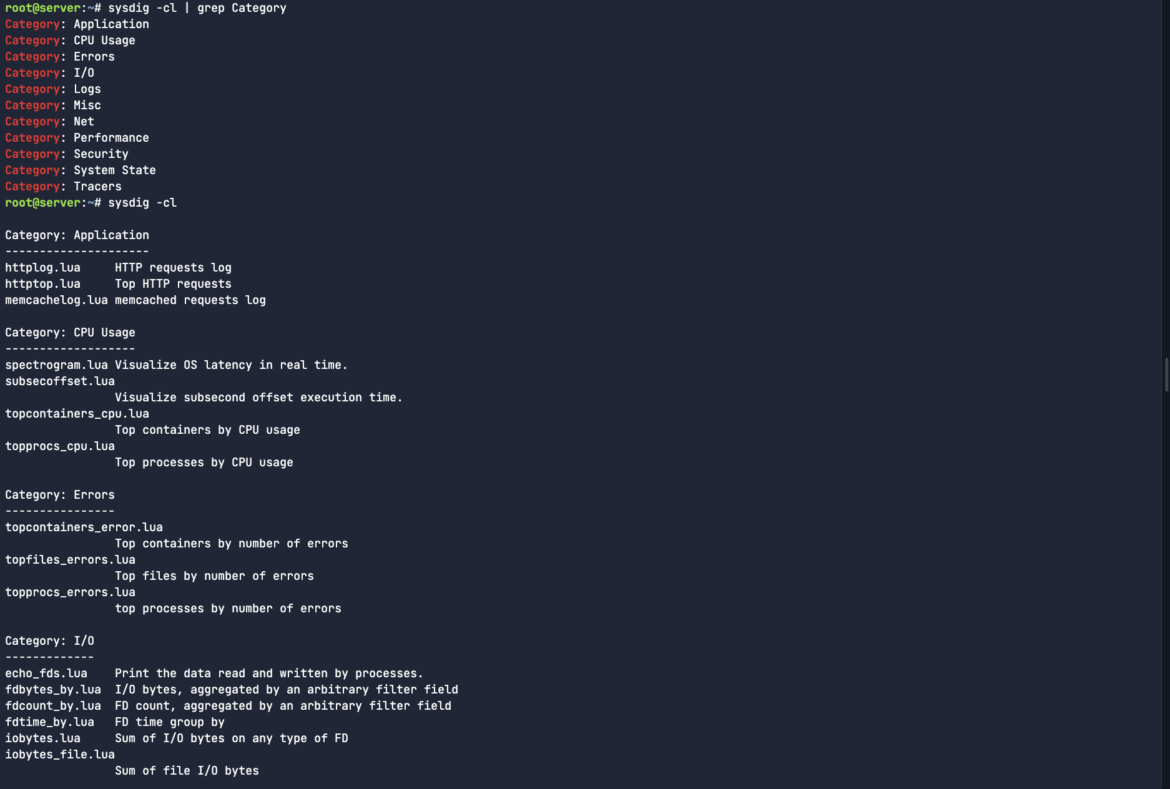
To run one of the chisels, you use the -c flag followed by the name of the chisel. In this case, it’s topfiles_bytes which is aggregating the most common file names by size at any given time. It’s a livestream of all the important activities.
sysdig -c topfiles_bytesCode language: Perl (perl)
Or you can look at all netcat activity for specific containerised/Kubernetes workloads.
sysdig -c netstat.luaCode language: Perl (perl)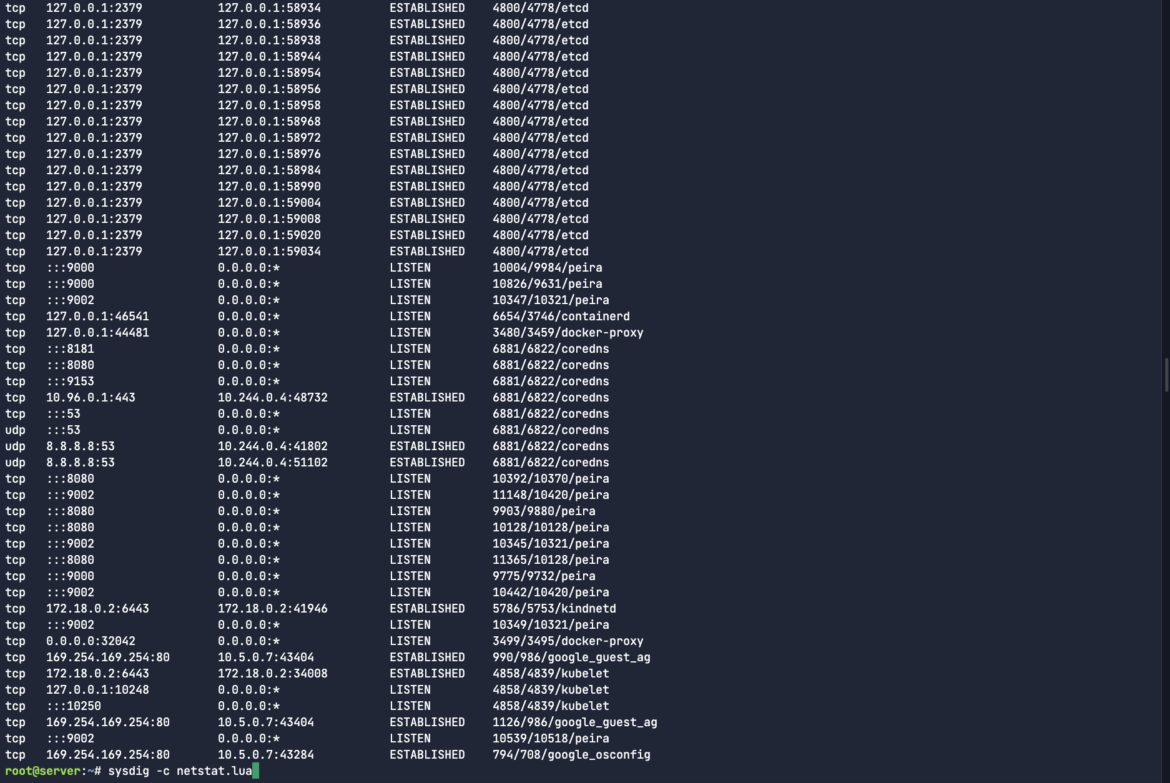
Since Sysdig is open-source, you have the flexibility to create your own chisels for addressing unique troubleshooting scenarios like those mentioned above. This level of granular control, essential for cloud-native investigations, is often missing from many enterprise cloud platforms. Sysdig Inspect stands out as a developer-centric solution designed for comprehensive digital forensics.
Key use cases for Sysdig Inspect
1. Post-Breach Forensics
After a security breach, you need to understand what led to the compromise. Sysdig Inspect’s ability to capture system call activity makes it invaluable for reconstructing the chain of events. You can see exactly what processes were involved, what files were accessed, and how network connections were made.
2. Performance Troubleshooting
Sysdig Inspect helps you diagnose performance bottlenecks by analyzing how processes and containers interact with system resources. From pinpointing slow database queries to identifying high CPU-consuming processes, it provides actionable data to improve your cloud-native app performance.
3. Designing Falco Rules
By analyzing real-world syscall data from captures, security engineers can refine or design new Falco rules. Understanding how legitimate or suspicious processes interact with your system makes it easier to fine-tune detection logic and minimize false positives.
Conclusion
Sysdig Inspect is an indispensable tool for both security and performance investigations in cloud-native environments. Whether you are responding to an incident, conducting post-breach forensics, or troubleshooting complex performance issues, Sysdig Inspect provides the deep visibility and control you need to make informed decisions. Its flexibility, especially through its CLI, allows for quick deployment and capture in any environment, making it a must-have for modern cloud operations.
Stay tuned for more insights on how to use Sysdig Inspect in different scenarios, and don’t forget to experiment with the powerful CLI features to automate and simplify your troubleshooting process.